
Employment
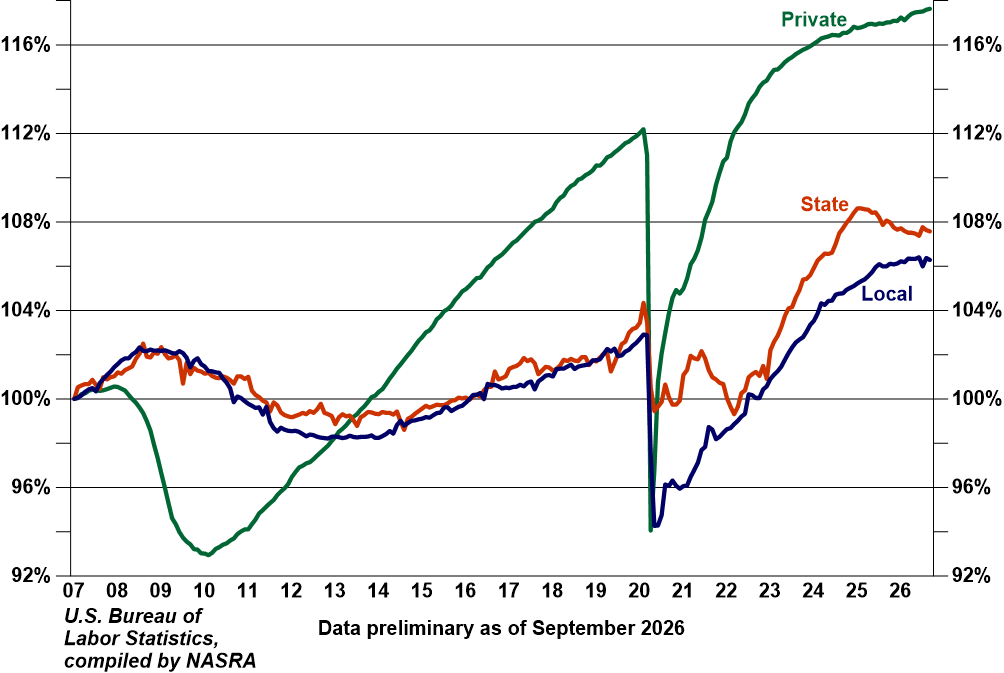
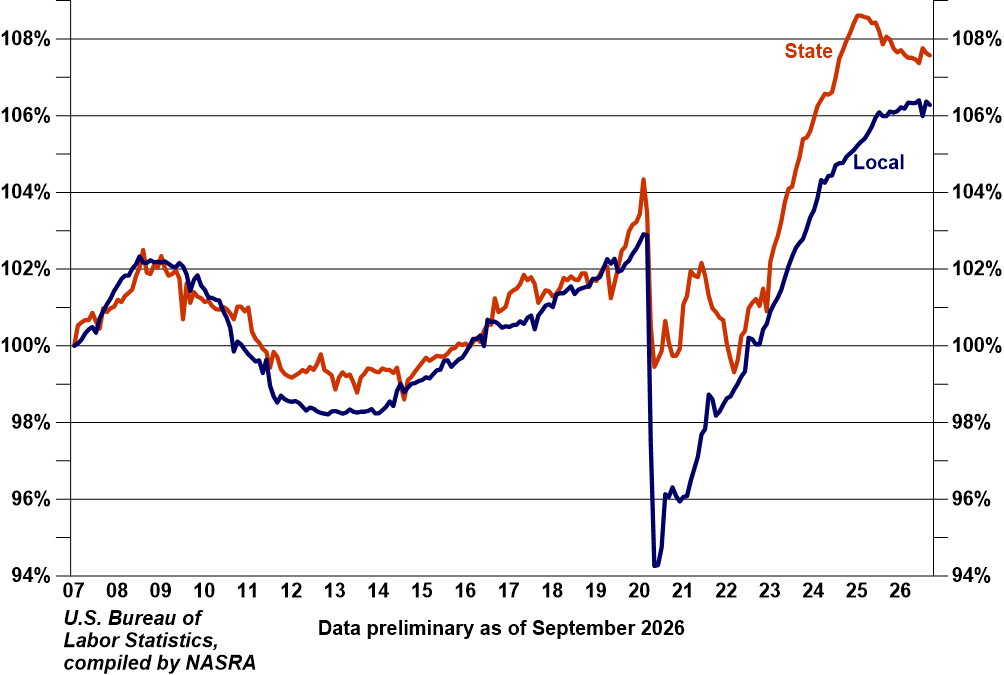
The U.S. Bureau of Labor Statistics reported that aggregate state and local government employment declined by an estimated 16,000 jobs from July to August 2026. Over the last 12 months state governments have lost an estimated 13,000 jobs and local governments have lost an estimated 14,000 jobs. The aggregate level of state and local employment exceeds its previous February 2020 peak by 645,000 jobs.
The BLS identifies approximately 20.6 million employees of state and local government as of September 2026. Local governments, which include most school districts, account for nearly three-quarters of total state and local employment, with state governments accounting for around one-quarter of the total. Overall, state and local employment accounts for approximately 13 percent of the nation's workforce.
The private sector added 46,000 jobs in September 2026.
The charts below present the relative changes in state and local government and private sector employment since 2007.
Monthly changes in state and local government
and private sector employment, 2007-2026
Monthly changes in state and local government employment, 2007-2026
Compiled by NASRA based on data provided by the U.S. Bureau of Labor Statistics. Data is sourced from the BLS Current Employment Statistics program, which is a monthly survey of households, businesses, and governments measuring employment, hours, and earnings estimates. The CES survey reference period is the pay period that includes the 12th day of the month. Data are published on a preliminary basis and revised twice before being finalized.
See more: https://www.bls.gov/ces/